Table of Contents
When you log into the Device Management System, the first thing that opens is the dashboard.
Here you can check the device status and storage usage.
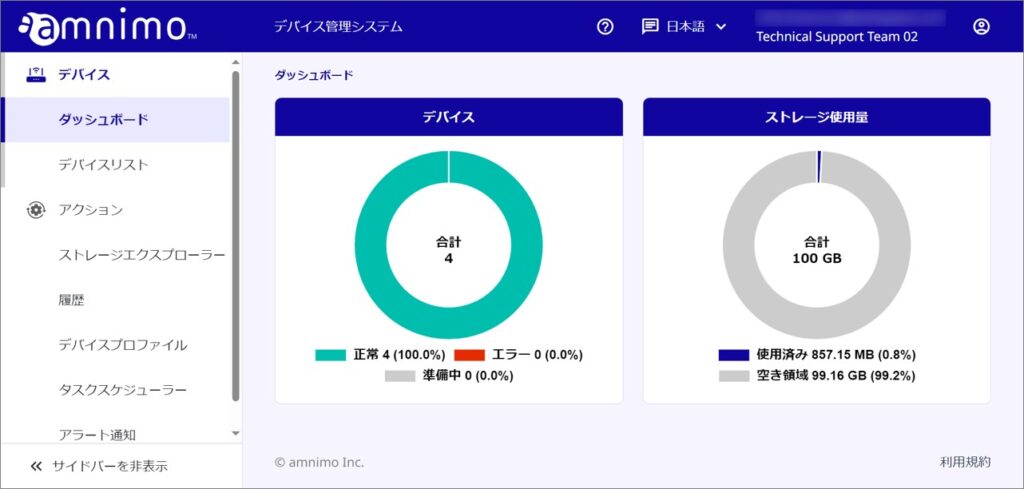
device #
You can check the status of the device. The meanings of the statuses are as follows
| normal | The number of devices that have been activated and are in communication status is displayed. |
| in preparation | The number of devices that have not been activated is displayed. Please activate them. |
| error | Displays the number of devices that have been activated but are experiencing errors. |
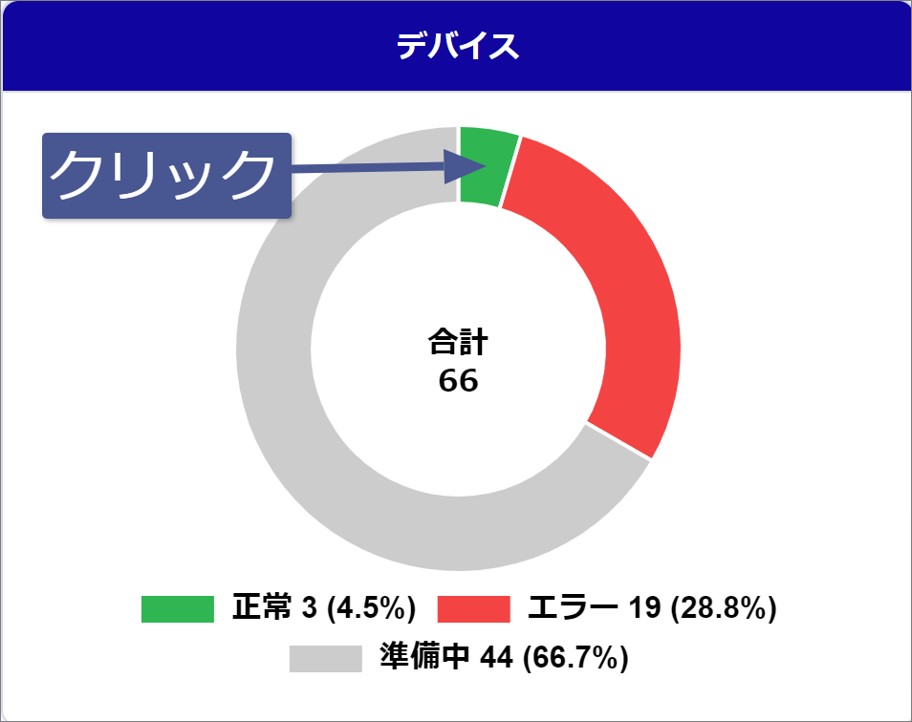
Clicking on each status (Normal, Error, Preparing) on the graph will display a list narrowed down by the selected status.
円グラフ上の表示をクリックする
Click on the "normal" area on the pie chart.
In the device list, a list filtered by "normal" is displayed.
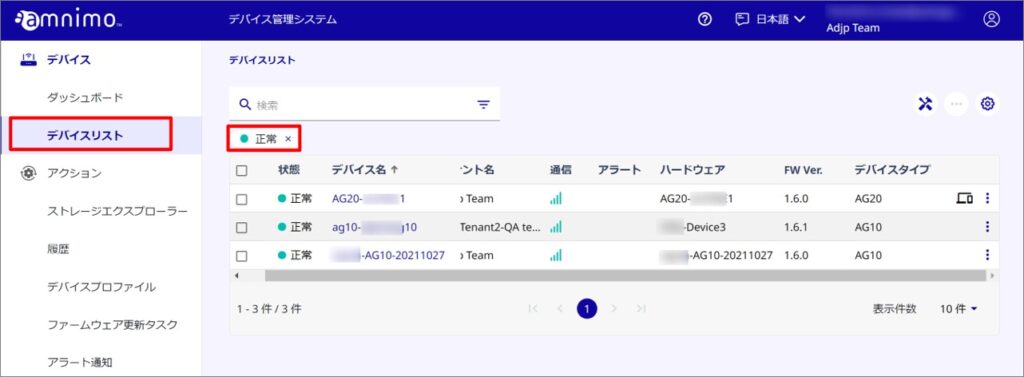
To deselect, click the "X" on the tag.
Storage usage #
The storage size used by the device and the available storage size are displayed.
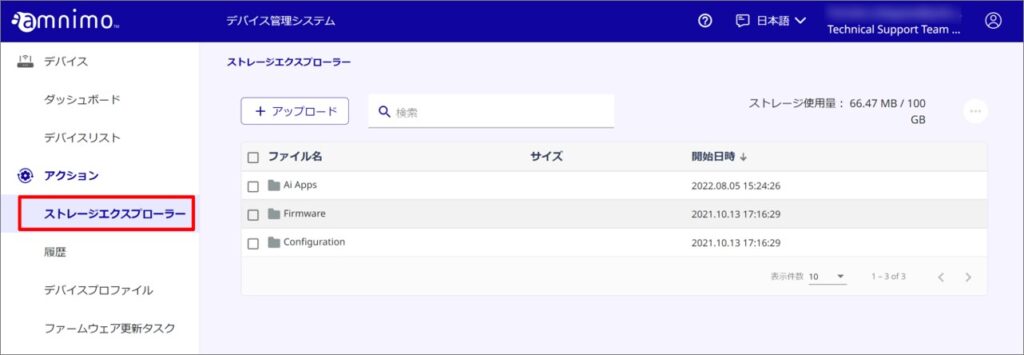
Click on the total area on the graph to display the Storage Explorer.
円グラフ上の合計部分をクリックする
Click on the "Total" display in the pie chart.
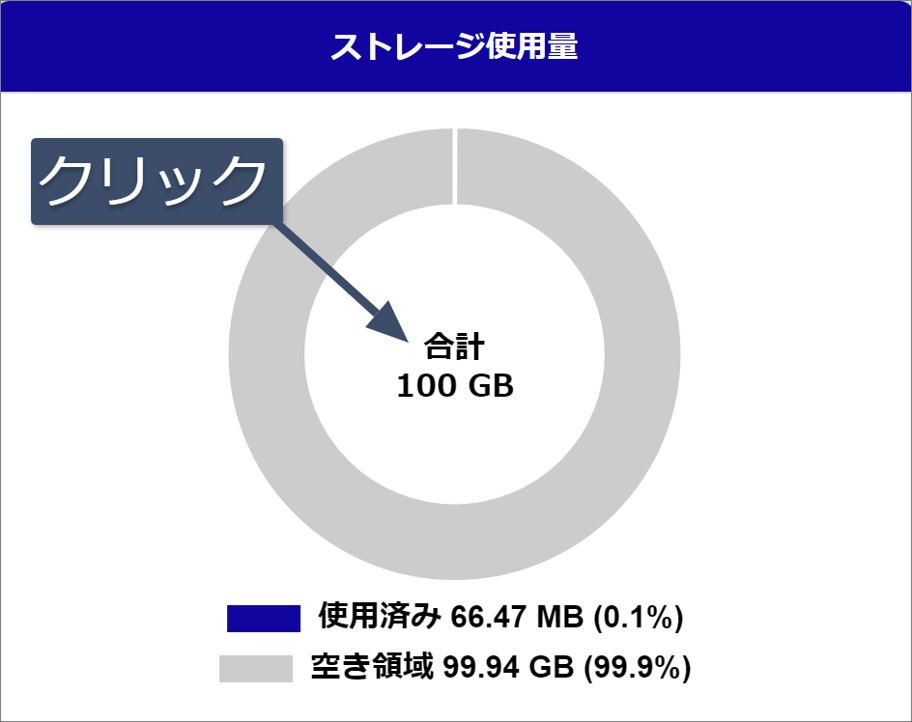
Storage Explorer will appear.