
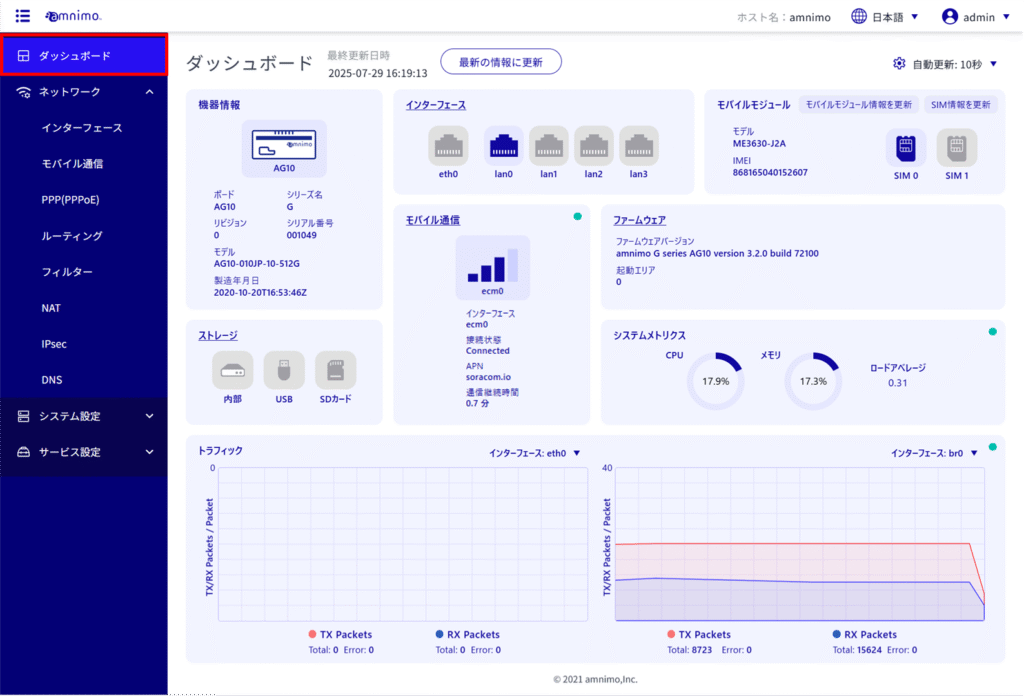
This section describes the operation of the "Dashboard" screen.
Click on "Dashboard" in the side menu to open the "Dashboard" screen.
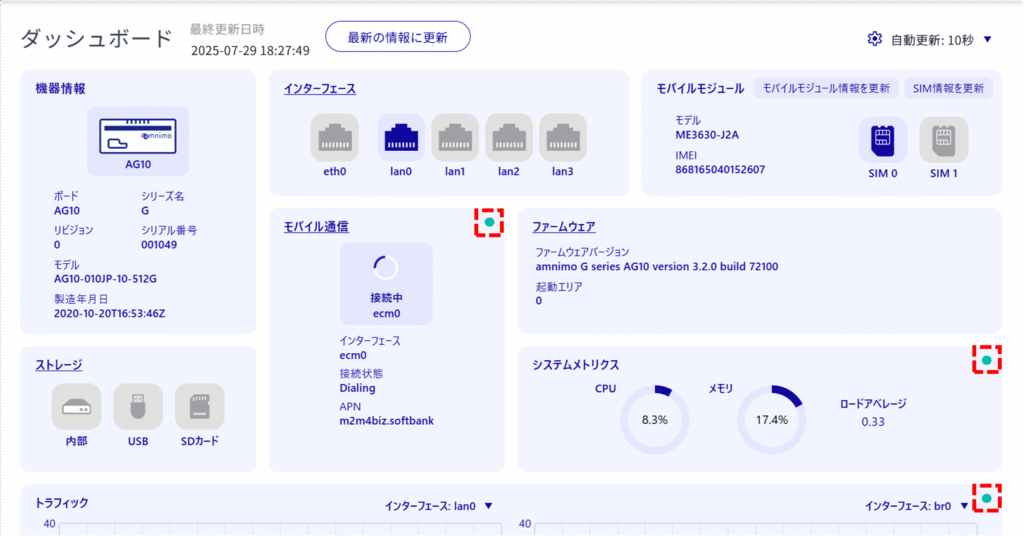
(The following image shows the dashboard of the indoor version of Edge Gateway (AG10). The elements shown on the dashboard may vary depending on the model of device you are using).
Item Description #
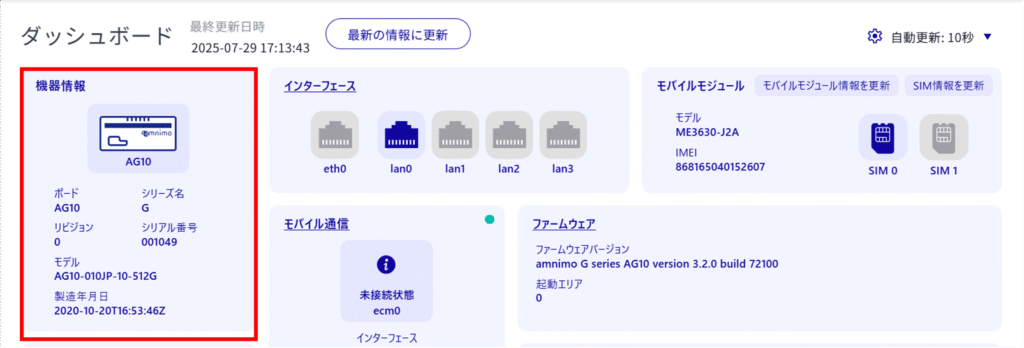
Equipment Information #
In the "Device Information" section, you can view device device information.
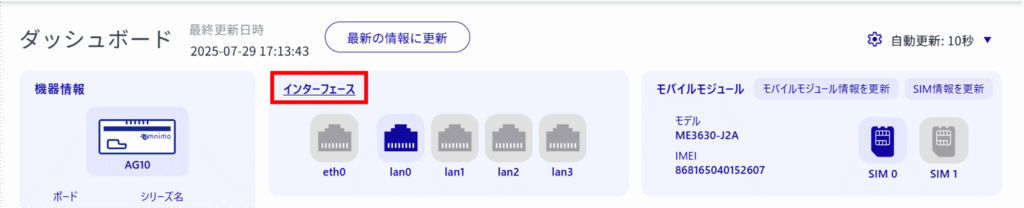
interface #
In the "Interfaces" section, you can check information about each port, including the link status of the interface.
The colors of the port icons relate to the actual link status as follows
Blue: link up
Gray: link down
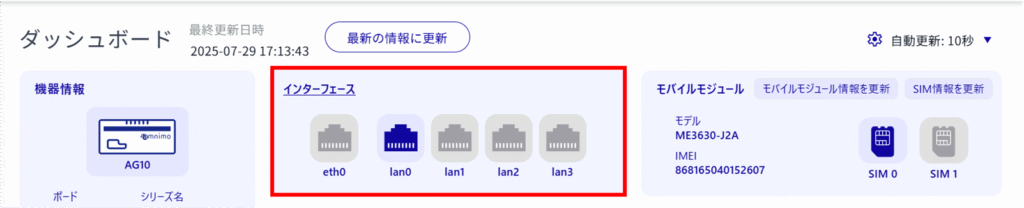
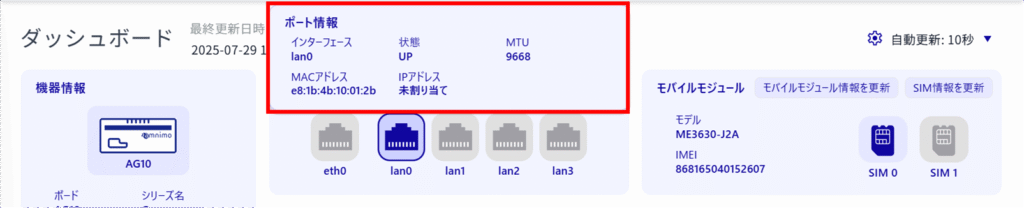
Click on the port icon to view detailed port information.
[Clicking on "Interface" will take you to the "Interface" screen.
Mobile Module #
In the "Mobile Module" section, you can check mobile module information and update mobile module and SIM information.
The color of the SIM icon relates to the actual connection status as follows
Blue: SIM inserted
Gray: No SIM inserted
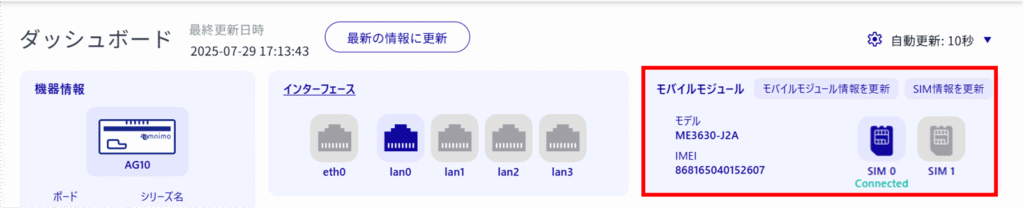
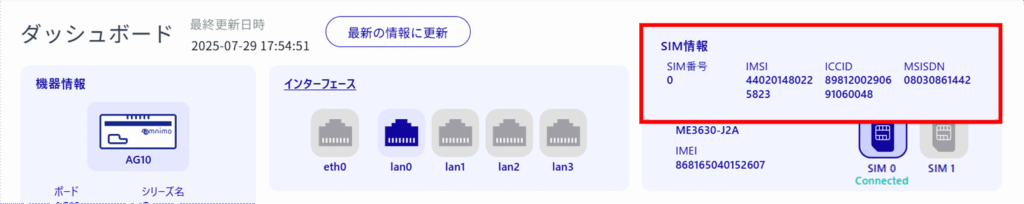
Click on the SIM icon to view detailed SIM information.
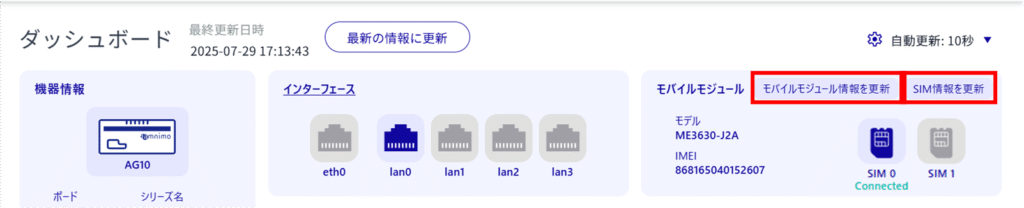
[Click "Update Mobile Module Info" and "Update SIM Info" to update mobile module and SIM information, respectively.
When updating, a dialog box will appear asking if you want to disconnect the current connection and update the information.
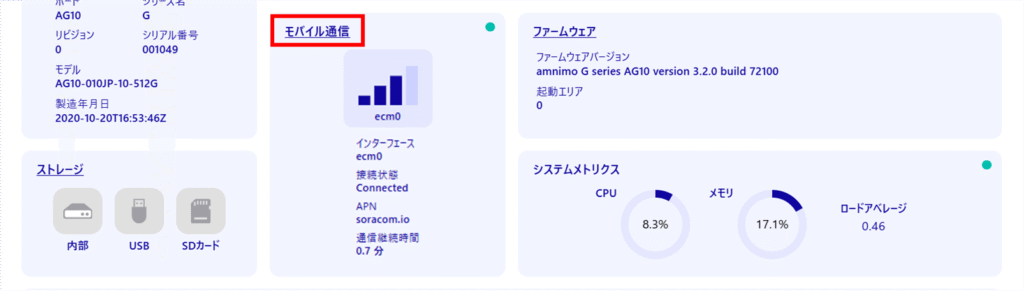
Mobile Communications #
Under "Mobile Communications," you can check the status of your mobile communications.
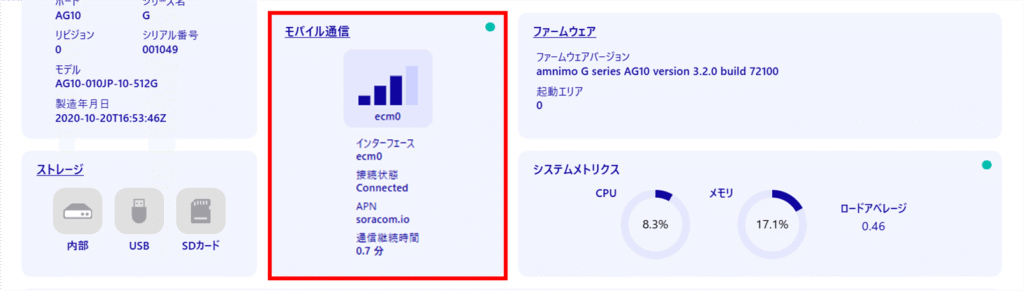
[Clicking on "Mobile Communications" will take you to the "Mobile Communications" screen.
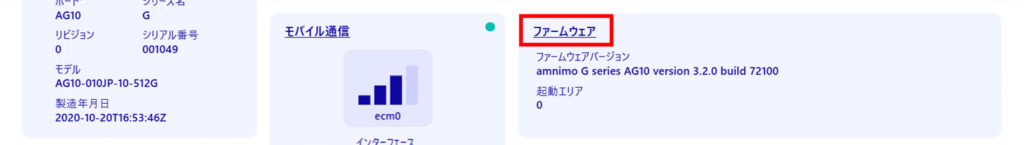
firmware #
Under "Firmware," you will find the firmware version and boot area.
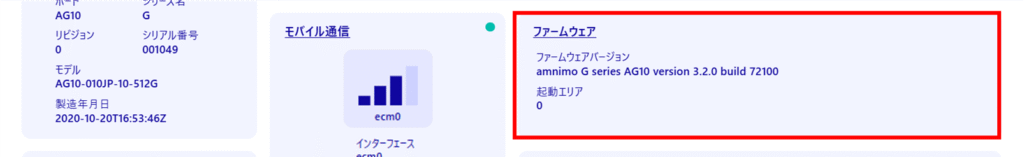
[Clicking on "Firmware" will take you to the "Firmware" screen.
storage #
Under "Storage," you will find the firmware version and boot area.
The color of each storage icon relates to the actual connection status as follows
Blue: connected
Gray: no connection
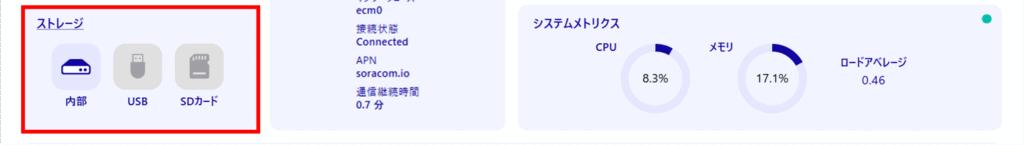
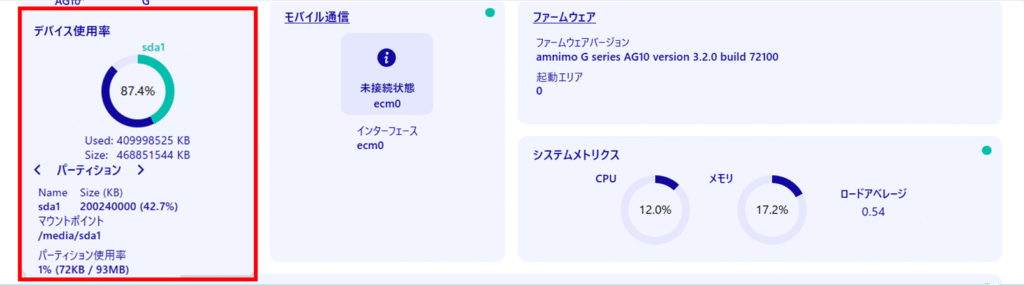
Click on the storage icon to check storage usage.
If there are multiple partitions, click "<" and ">" in "< Partition >" to see the details of each partition.
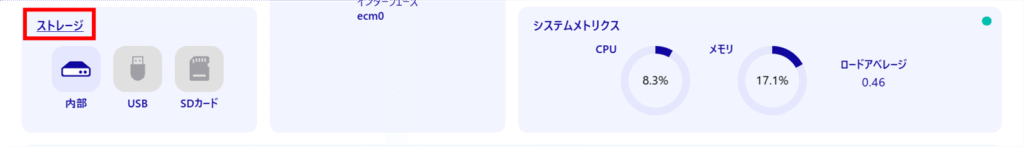
[Click Storage to go to the "Storage" screen.
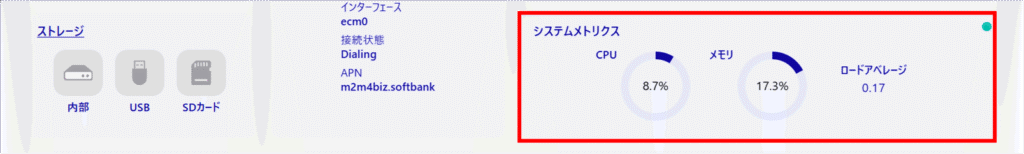
system metrics #
The "System Metrics" section shows CPU and memory utilization and load average.
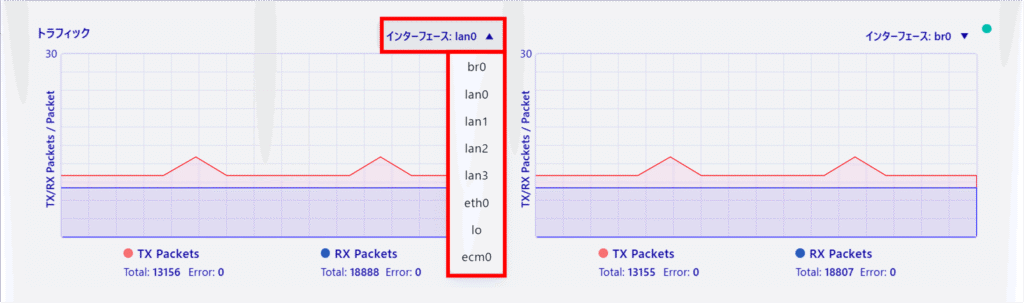
traffic #
In the "Traffic" section, you can see the traffic for each interface.
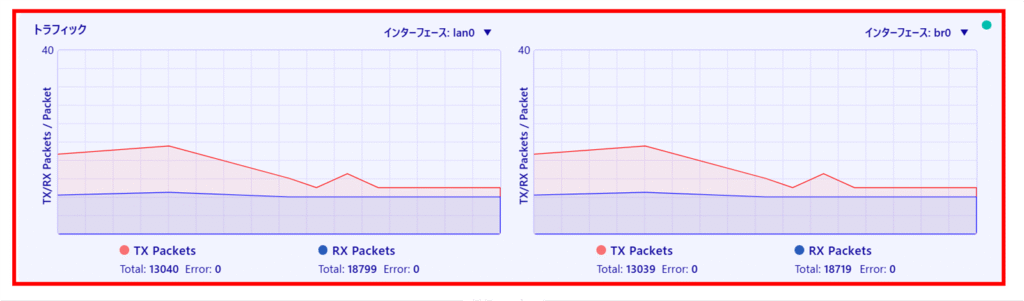
[Clicking on "Interface: ●●" allows you to select the interface to display the traffic in the pull-down menu.
automatic updating #
Information on items marked in green in the upper right corner is automatically updated at set time intervals.
The automatic update interval can be set from the pull-down menu that appears when you click [Auto Update: ●●] in the upper right corner of the screen.
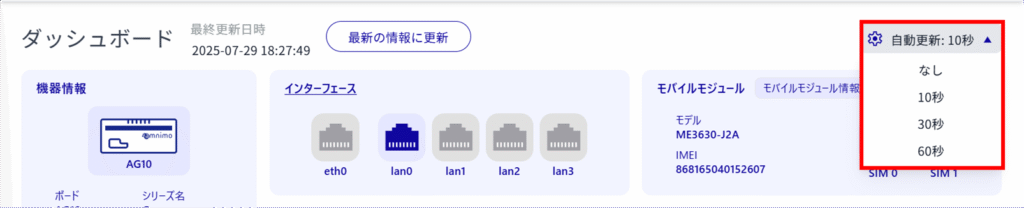
If you set "Auto Update: None", you can update the "Dashboard" screen by clicking "Update to Latest Information".